Project Overview
A Python desktop application for enterprise internet usage monitoring — tracking which departments consume the most bandwidth, identifying peak usage hours, flagging non-productive browsing, and generating executive summary reports.
The tool reads usage logs, processes them with Pandas, and renders interactive visualisation charts via Matplotlib — all within a clean Tkinter GUI.
Core Analytics Modules
- Department Usage Analysis — bandwidth consumption by department and team
- Peak Hours Detection — hourly usage patterns to identify bottlenecks
- Daily Usage Trends — daily and weekly usage trend lines
- Top 10 Sites — most visited domains ranked by time and data usage
- Category Breakdown — productive vs non-productive category classification
- Productivity Scoring — department-level productivity score calculation
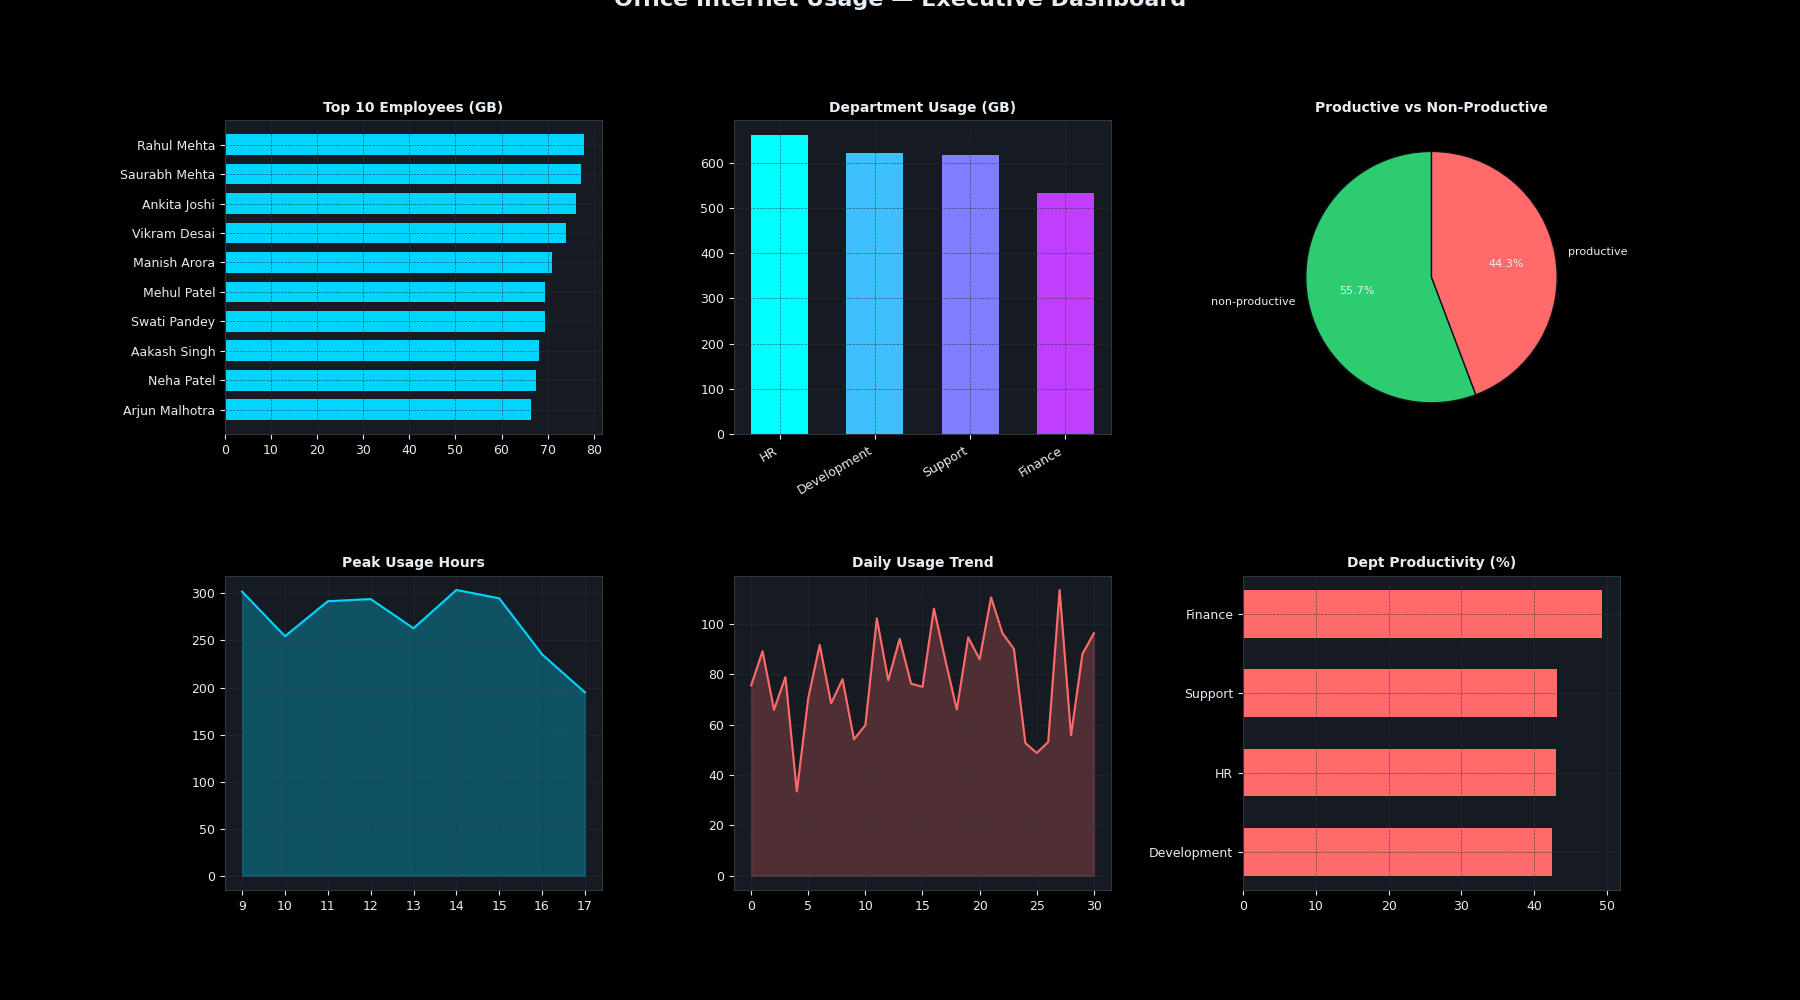
- Executive Dashboard — full summary report exportable as PNG/CSV
Technical Implementation
- Custom Tkinter GUI with tabbed navigation for each analytics view
- Pandas for data ingestion, cleaning, and aggregation pipelines
- Matplotlib embedded within Tkinter for live chart rendering
- CSV export for all aggregated reports — compatible with Excel/BI tools
- Logging system for audit trail — saves daily analytics logs
- Configurable thresholds for productivity classification
Use Case & Impact
Gives IT and management complete visibility into internet consumption without expensive enterprise tools. The productivity score helps identify departments with high non-productive browsing — enabling focused policy interventions.
Application Screenshots
Category Breakdown — productive vs non-productive
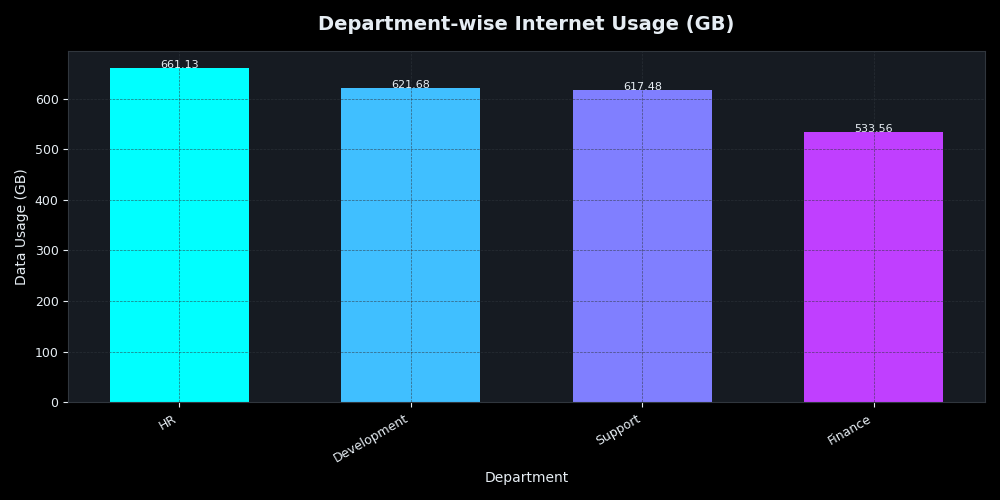
Department Internet Usage — bandwidth by team
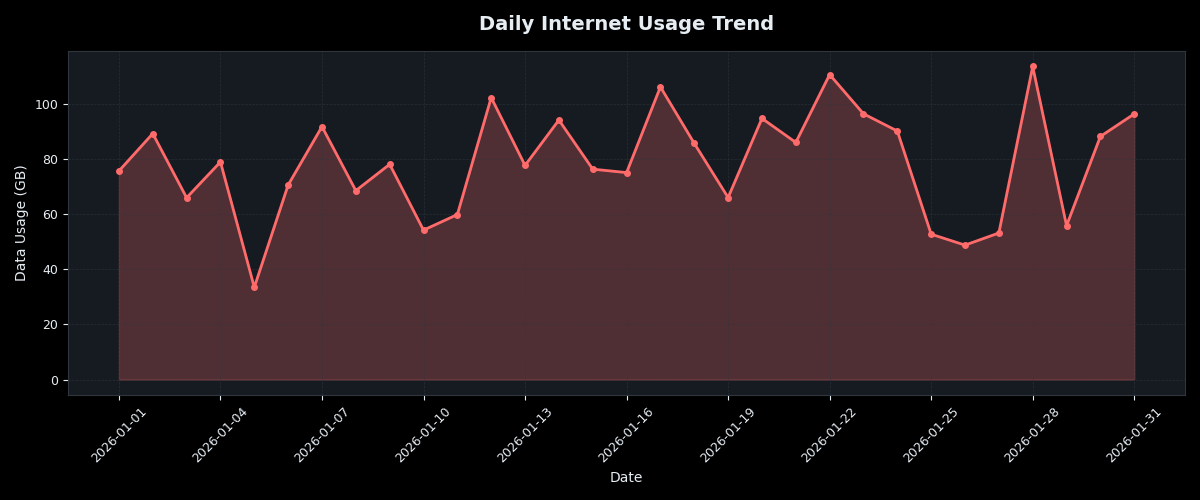
Daily Usage Trend — time series analysis
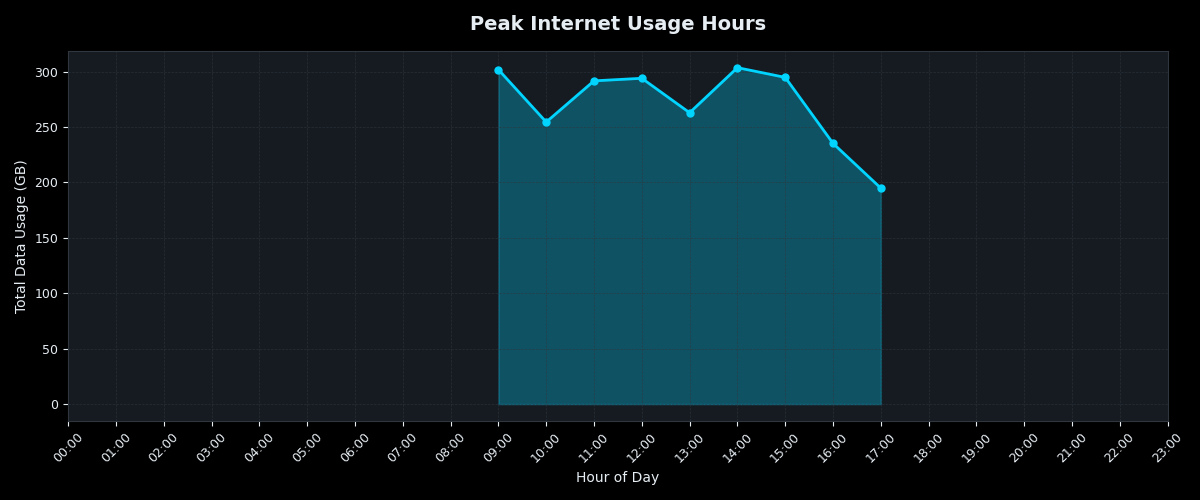
Peak Hours Detection — usage heatmap
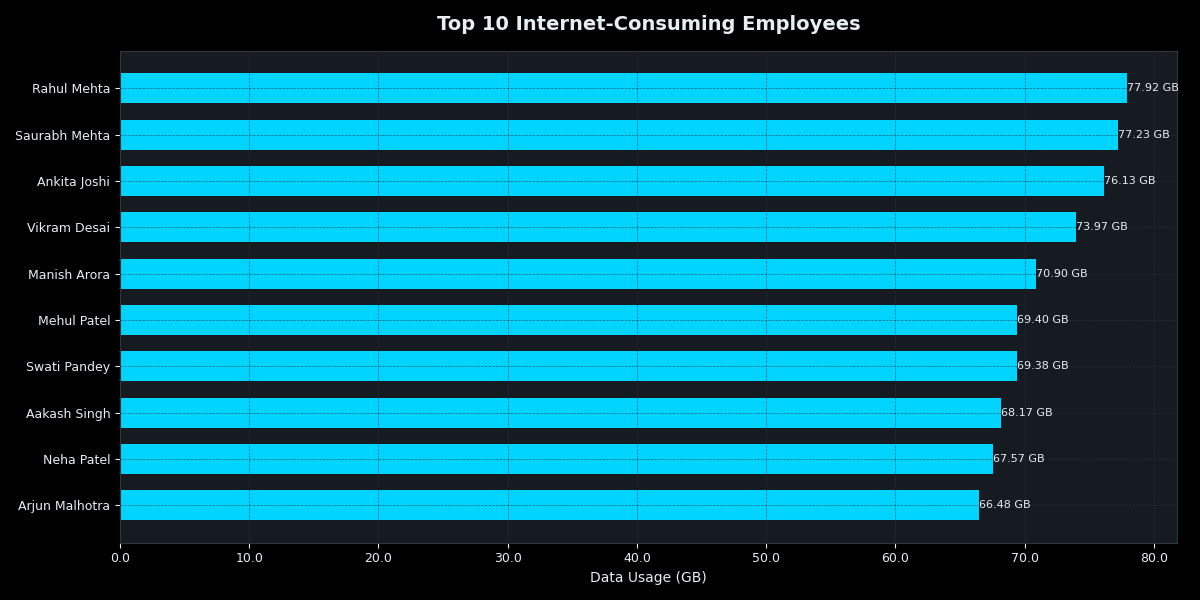
Top 10 Most Visited Sites
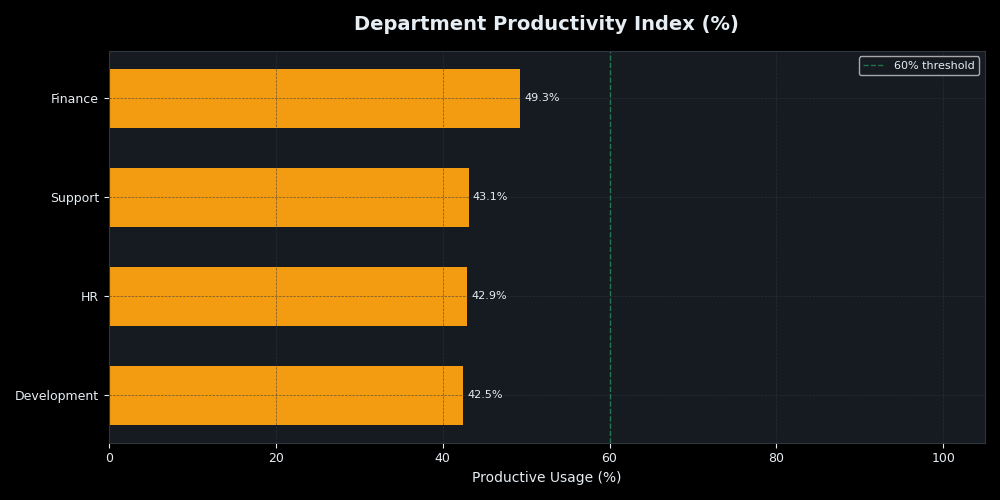
Department Productivity Scores